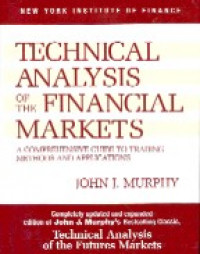
Technical analysis of financial markets : a comprehensive guide to trading methods and applications
| Gmd : Text
| Availability :
| 00000009396 | HG6046 .M87 1999 REF | (Reference) | Available - Ada |
| 00000009549 | HG6046 .M87 1999 REF | (Reference) | Available - Ada |
This outstanding reference has already taught thousands of traders the concepts of technical analysis and their application in the futures and stock markets. Covering the latest developments in computer technology, technical tools, and indicators, the second edition features new material on candlestick charting, intermarket relationships, stocks and stock rotation, plus state-of-the-art examples and figures. From how to read charts to understanding indicators and the crucial role technical analysis plays in investing, readers gain a thorough and accessible overview of the field of technical analysis, with a special emphasis on futures markets. Revised and expanded for the demands of today's financial world, this book is essential reading for anyone interested in tracking and analyzing market behavior.
Technical Analysis of the Financial Markets expands upon and updates Murphy's classic Technical Analysis of the Futures Markets. Packed with some 400 real-life charts that clarify every key point, it covers:
* the fundamentals of technical analysis and chart construction
* what you must know about trends and the building blocks of chart analysis
* price patterns, including major revearsal and continuation patters
* methods of analysis - moving averages, oscillators, contrary opinion, and other indicators
* time cycles, market interrelationships, money manegement, and trading tactics
Beginners and experienced traders alike will find a wealth of immediately useful information in this authoritative, yet easy-to-follow guide.
Contents:
Introduction
1. Philosophy of technical analysis
2. Dow theory
3. Chart construction
4. Basic concepts of trend
5. Major revearsal patterns
6. Continuation patterns
7. Volume and open interest
8. Long term charts
9. Moving averages
10. Oscillators and countrary opinion
11. Point and figure charting
12. Japanese candlesticks
13. Elliott wave theory
14. Time cycles
15. Computers and trading systems
16. Money management and trading tactics
17. The link between stocks and futures : intermarket analysis
18. Stock market indicators
19. Pulling it all together - a checklist
A. Advanced technical indicators
B. Market profile
C. The essentials of building a trading system
D. Continuous futures contracts
Index
About the Author
John J. Murphy is President of MURPHYMORRIS, Inc., a producer of interactive educational products for technical analysis. A former technical analyst for CNBC and director of Merrill Lynch's Technical Analysis Futures Division, he is the author of The Visual Investor and Intermarket Technical Analysis.
| Series Title |
-
|
|---|---|
| Call Number |
HG6046 .M87 1999 REF
|
| Publisher Place | New York |
| Collation |
xxxi, 542p.: ill.; 25cm.
|
| Language |
English
|
| ISBN/ISSN |
0735200661
|
| Classification |
HG6001-6051
|
| Media Type |
-
|
|---|---|
| Carrier Type |
-
|
| Edition |
-
|
| Subject(s) | |
| Specific Info |
-
|
| Statement |
-
|
| Content Type |
-
|
No other version available


